.

I have supervised five bachelor's theses during the spring term and the students just handed in their theses to the examiner. The students work in pairs so these 10 students will have one last chance to correct or change their thesis after the examination (next week), but the version they just handed in is what will be examined and graded (pass/fail), so it's pretty official.
I usually supervise two groups of students but I had only one group this year. Having 10 students (5 theses) is on the other hand a quite large group. Three pairs worked with thesis proposals that came from my/our Flight research project ("Decreased CO2-emissions in flight-intensive organisations"). That means I have been both "client" as well as "advisor" and I present these three theses first.
I have used the students' thesis abstracts as a starting point for the texts below and have shortened and simplified them, but then also added text when I felt it was necessary and also added images as I have seen fit. DO NOTE that despite the fact that these "processed abstracts" use "we" (signifying "we the students"), I have made significant changes compared to the real abstracts (primarily by shortening them but sometimes by clarifying things etc.).
The last time I wrote about the bachelors' theses I supervised was in 2020. I supervised two groups of students and wrote two blog post (one about each group; Flight theses and Homo Colossus theses).
KTH’s Fastest Professor: An Analysis of Academic Flying (Vivi Andersson & Gustav Sundin)
This thesis is inspired by KTH professor Metsola van der Wijngaart's proposal regarding academic flying, i.e. "only fly if per 0.1 ton of CO2e you emit, you spend one efficient workday at your destination". This perspective focuses on emissions per day of traveling and thus differs from (only) looking at an individual's total emissions. Based on an anonymized data set of all 2019 air travel at KTH, we analysed academic flying at KTH in terms of "emission speed" (CO2e per travel day). This thesis thus examines 1) the top 10 KTH employees who have the highest emission speed (CO2e per travel day) and 2) the 10 "top emitters" who fly the most (who rack up the most air miles and have the highest total CO2e emissions). If these groups differ, what are the travel patterns that underlie these differences?
Our analysis shows that these two lists differ significantly, with only one individual having a top 10 position in both lists. Those with high emission speeds often made a small number of trips that were often long distance, sometimes in business class, and had a short duration (e.g. traveling far and staying away for only a few days). Top emitters had made a larger number of trips, but a few short-distance long-duration trips lowered their 2019 average emission speed. Our conclusion is that emission speed can provide a different perspective compared to total emissions, and that the CO2e-per-travel-day index can be used to analyze individual trips to find candidates that might represent "unnecessary" trips, e.g. trips that could or should be avoided.

Top 10 KTH employees who have the highest emission speed (from 1200 to 650 kg CO2e per travel day). Professor C (third column) is the only person who are both this list and the list of top 10 emitters at KTH (clocking in at 21 000 kg of CO2e emissions from business trips during 2019).

Professor D is the top polluter at KTH with total of 53 000 kg of CO2e emissions from business trips during 2019. With 32 trips made during 2019, this professor has more than twice as large CO2e emissions as the second highest polluter.
Visualizing flight data for heads of departments: A tool to decrease academic flying (My Andersson & Fanny Erkhammar)
To live up to the promises made in the Paris Agreement, all countries and all organisations need to reduce their flight-related emissions. Universities (including KTH) are among the top polluters among Swedish governmental agencies. We have therefore built a prototype of a visualization tool with the aim of providing KTH heads of departments with an overview of their departments' flying. We more specifically asked "how can we, by visualizing flight data, help KTH heads of departments get an overview of their department’s air travel for the purpose of supporting decision-making that can help reduce the carbon emissions?".
We performed interviews with participants from the target group, developed a prototype and then performed user tests with the target group. Participants were interest in the tool and came with suggestions about additional functions they would like to have. The study also however showed that the implementation and use of a tool such as this is not currently relevant due to the lack in clear guidelines from KTH about individuals or departmental CO2 emission reduction targets. This means that heads of departments currently have no foundation upon which they can base their decisions on. Such guidelines need to be developed and integrated into the tool for it to be of use to KTH heads of departments.

A large department with dozens of employees. Color = total CO2 emissions, height = number of trips. The blue figure represents KTH's goal and dark red = > 5 times more emissions that KTH's (blue) goal.
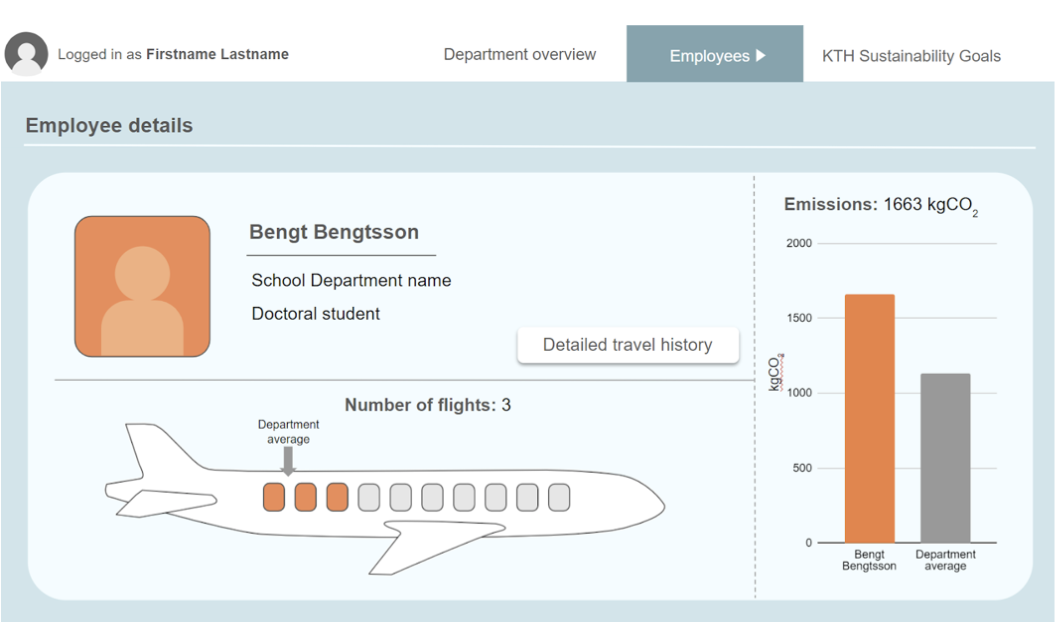
The head of the department can zoom in on individual employees. Orange windows in the plane = number of trips made this year. Grey bar (right) = average emissions at the department.
80-20: A visualization of business travel habits at KTH (Jackie Hellsten & Saga Oldenburg)
Aviation releases large amounts of carbon dioxide into the atmosphere, and it is the norm in the academic world to travel around the world to network and to spread one’s research results (and CO2 into the atmosphere). This does however not align with global attempts to lower emissions. To break the norm of flying, discussions must be held about how universities can lower their emissions from aviation. At KTH, 20% of all scientists currently contribute to 80% of all researchers' flight-related CO2 emissions.
Our aim has been to investigate the following question: “In order to evoke reflection and discussion regarding the uneven distribution of carbon dioxide emissions from aviation amongst scientists, how can an interactive installation be designed to achieve this?”. The thesis uses Research Through Design and critical design to examine this question. Multiple interviews were held with employees at different universities in Sweden to test and evaluate how effective the prototype installation was at evoking discussion. Users guessed how aviation-related emissions are distributed amongst KTH researchers (in the installation's interactive interface) only to then have the actual distribution visualized (with dramatic effects) and where the goal was to invoke reflection through the addition of a number of provocative elements. The interviews indicated that the installation would be successful at evoking reflection and discussion about the distribution of aviation-related emissions if it were to be placed in a public space at the university.


The installation invites you to guess about the distribution of CO2 emissions from flying for three groups at KTH (based on 2019 pre-Covid data, see the image below); low-fliers, medium-fliers and super-fliers (in green, orange and red, and with the latter group representing 20% of all KTH researchers.

This Lorenz curve describes the distribution of CO2 emissions from flying among 2600 KTH researchers in 2019. These (yet-unpublished) research results comes from the Flight research project (see above) and constituted input to this thesis. In the previous image someone guessed the distribution of CO2 emissions from low-, medium- and super-fliers were 20% - 30% - 50%. The real distribution is 0% - 20% - 80%.


The flight tower doubles as a ruler (with percent of current emissions to the left and absolute numbers - tons of CO2 - on the right side of the ruler/flight tower). The red flag represents KTH's targets for CO2 emissions from flying eight years from now (in 2030).
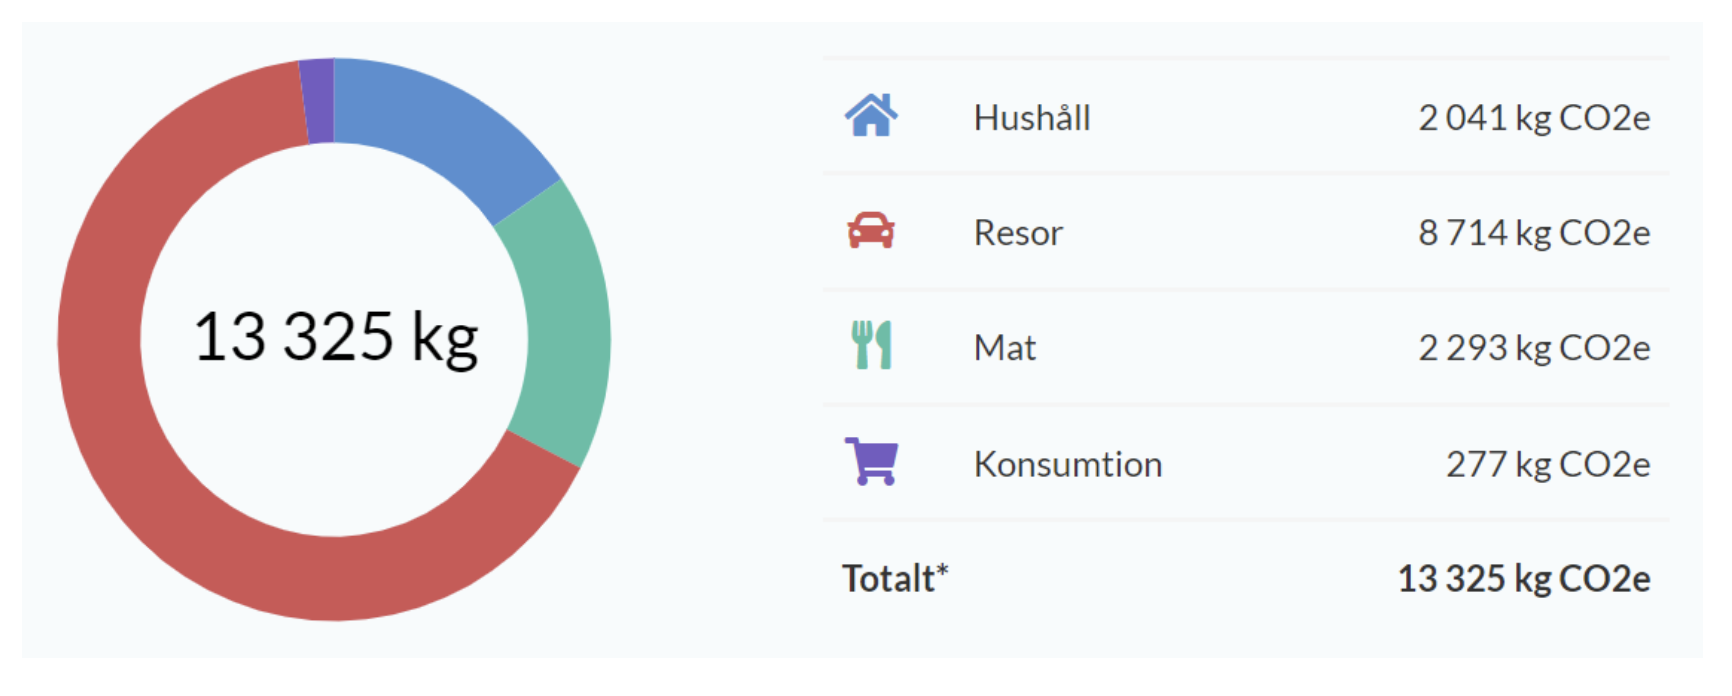
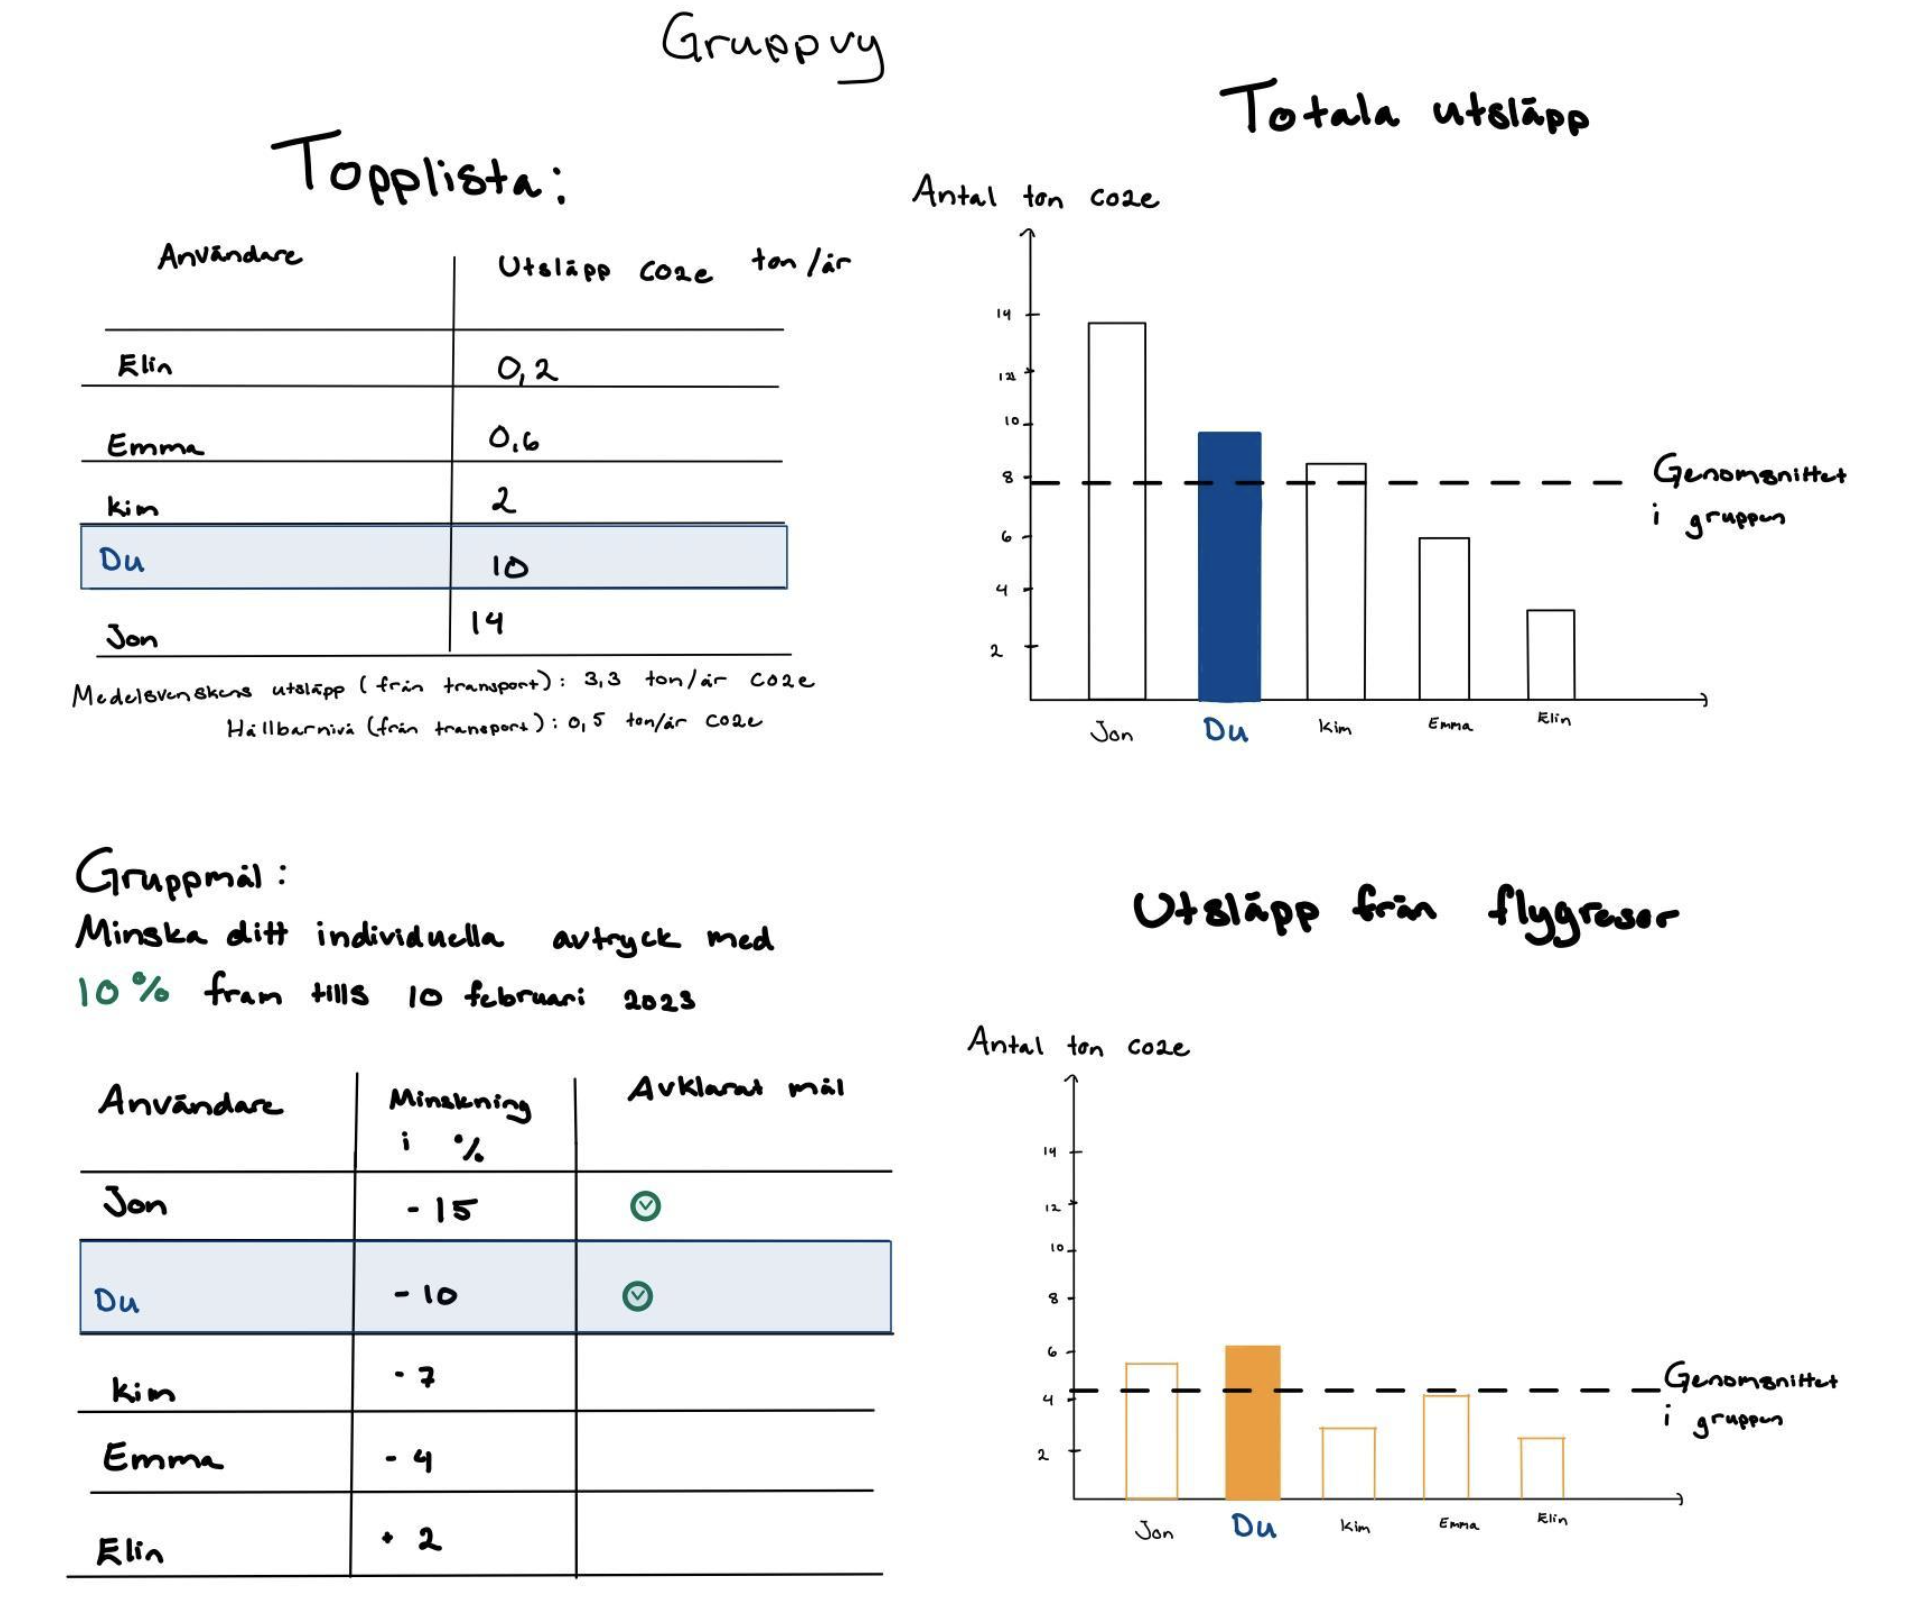
Adding social comparisons to carbon footprint calculators? A study in comparisons of carbon footprints between individuals (Malin Lundstedt & Marcus Gåhlin)
The Paris Agreement stipulates that average emissions of CO2e per person should be reduced to below 1 ton in 2050. In 2019, the average Swede's emissions from transport alone accounted for 1,7 tons of CO2e. Carbon footprint calculators are used to calculate an individual’s carbon footprint. Some calculators have added social comparisons (between individuals or within a group). This functionality is promising but further studies are needed and we have investigated how to add social comparisons to climate calculators' carbon footprint of transport. We more specifically examined four sub-questions among people with a strong interest in sustainability:
- Their attitude towards finding out their carbon footprint from transport.
- Their attitude towards comparing that footprint with others.
- What influences their attitude.
- What their attitude is based on.
In this qualitative study, 9 people who were intensely interested in sustainability participated in semi-structured interviews. The results showed that they were less interested in the footprint from transport and much more interested in their total carbon footprint (and how to reduce it). There was an interest in comparing their emissions with others, but this interest was also affected/tempered by 1) the level of detail in the carbon footprint (touching on privacy issues), 2) who you compare with (friends, strangers) and 3) your own emissions compared to the average.


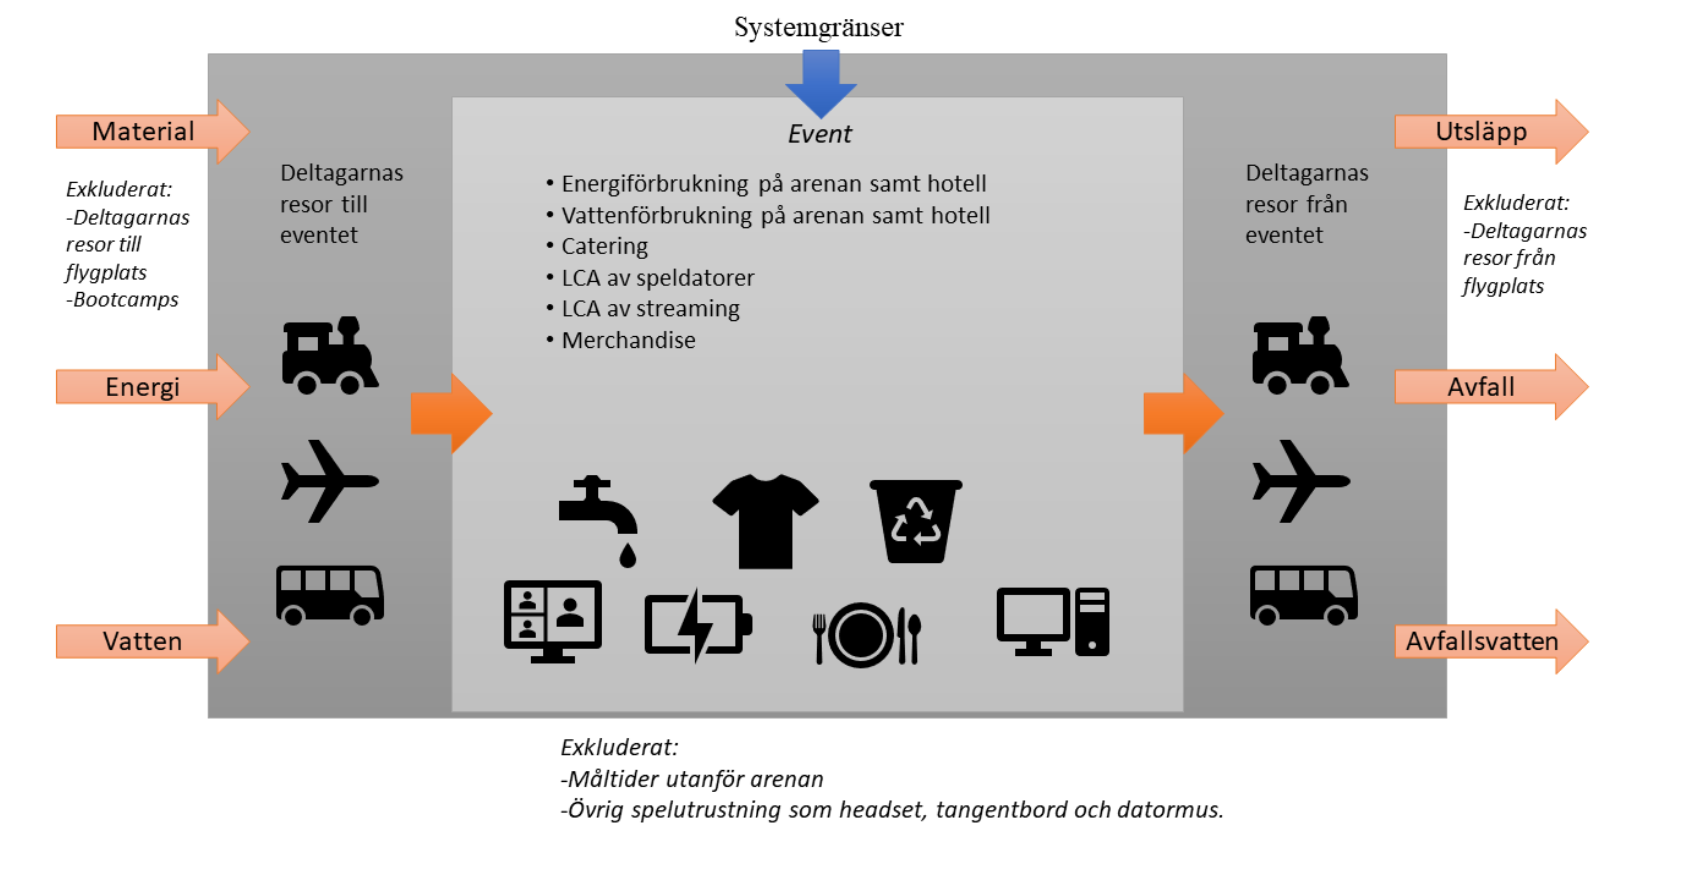
LCA on E-sports in Counter Strike (Henric Andersson & Nathalie Lock)
Competitive gaming, E-sports, have become very popular, including an interest in watching competitions live and a massive interest in watching competitions over the Internet. Something that has garnered less interest is the environmental impact of these events. No life cycle assessment (LCA) of an E-sports event has been published this far, so it is impossible to say anything specific about the environmental footprint/impact of these massive events.
We have aimed at helping to create the foundation for making a life cycle assessment of an E-sports event. Our case is a very large 13-day event around the very popular e-sports game Counter-Strike: Global Offensive (CS:GO). The event we chose was the Pro Gaming League (PGL) Major in Stockholm 2021. Our main question is: how can 1) system function, 2) functional unit and 3) system boundaries be chosen in order to carry out a LCA of the PGL Major Stockholm 2021? This is to a large extent a literature study but two persons with deep expertise in the field have also been interviewed (the head of the national Swedish CS:GO team/captain of The Swedish E-sports Association (SESF) and the head of sponsorship (both e-sports and traditional sports such as football and ice hockey) at SESF's main sponsor Svenska Spel).
The proposed choices (system boundaries etc.) we made resulted in a model that includes the majority of everything that occurs within the arena during the 13-day event, as well as flights, electricity consumption and water consumption from the hotels.

Earlier LCA studies of specific events provided input and inspiration, including a study of the environmental footprint of holding a three-day international academic conference (Neugebauer, Bolz, Mankaa & Traverso (2020), "How sustainable are sustainability conferences?–Comprehensive Life Cycle Assessment of an international conference series in Europe". Journal of cleaner production, 242, 118516).
--------------------
Besides the five bachelor's theses that I have supervised (above), my colleague and phd student Aksel Biørn-Hansen has, during the spring term, also supervised two master's theses that have been written within the Flight research project (Decreased CO2-emissions in flight-intensive organisations):
.
Inga kommentarer:
Skicka en kommentar